BEYOND IMAGES
Aaron Wienkers
Department of Applied Mathematics and Theoretical Physics
You are now peering 4.5 billion years into the past, just 27,000 years after the start of the gravitational collapse of a nebular cloud core, observing from a safe 100 billion kilometres above as our natal solar system forms. Below you is a turbulent whirlpool of swirling and shearing dust and hydrogen gas — a protoplanetary disc. As this disc continues to collect mass from the nebular nursery, it extends to nearly twice the size of our final solar system. This simulation was evolved using a massively parallel radiation-magnetohydrodynamics code and employing one of the fastest supercomputers in the US.
Part of the Cambridge Science Festival
Curated and Produced by Toby Smith
St Michael’s Church, Trinity Street, Cambridge CB2 1SU
Exhibition Open to the Public Daily
Monday 7th March – Saturday 19th of March – 8am – 5pm
Late Opening
Monday 7th March – 6pm -> 9pm
Research, academic and practical work in the fields of conservation, geography, biology, medical, material and social sciences has long embraced photographic imagery either as a raw data source or as illustration. As technology, digital imagery, data-sets and analysis grows in sophistication a new dynamic and virtual aesthetic is emerging that is closely integrated with new areas of research.
We have sourced these incredible images from 22 scientists working across 12 departments within the University. They have been collated, presented, modified and adapted into rich photographic prints accompanied by informative captions. The exhibits were chosen deliberately to avoid traditional lens based photography and in so doing have become diverse in their scale, ambition, gravity and playfulness. The insatiable curiosity and wonder of science has been made visible to us with intense, colours, scales, accuracy and compositions only possible with a mechanical eye.
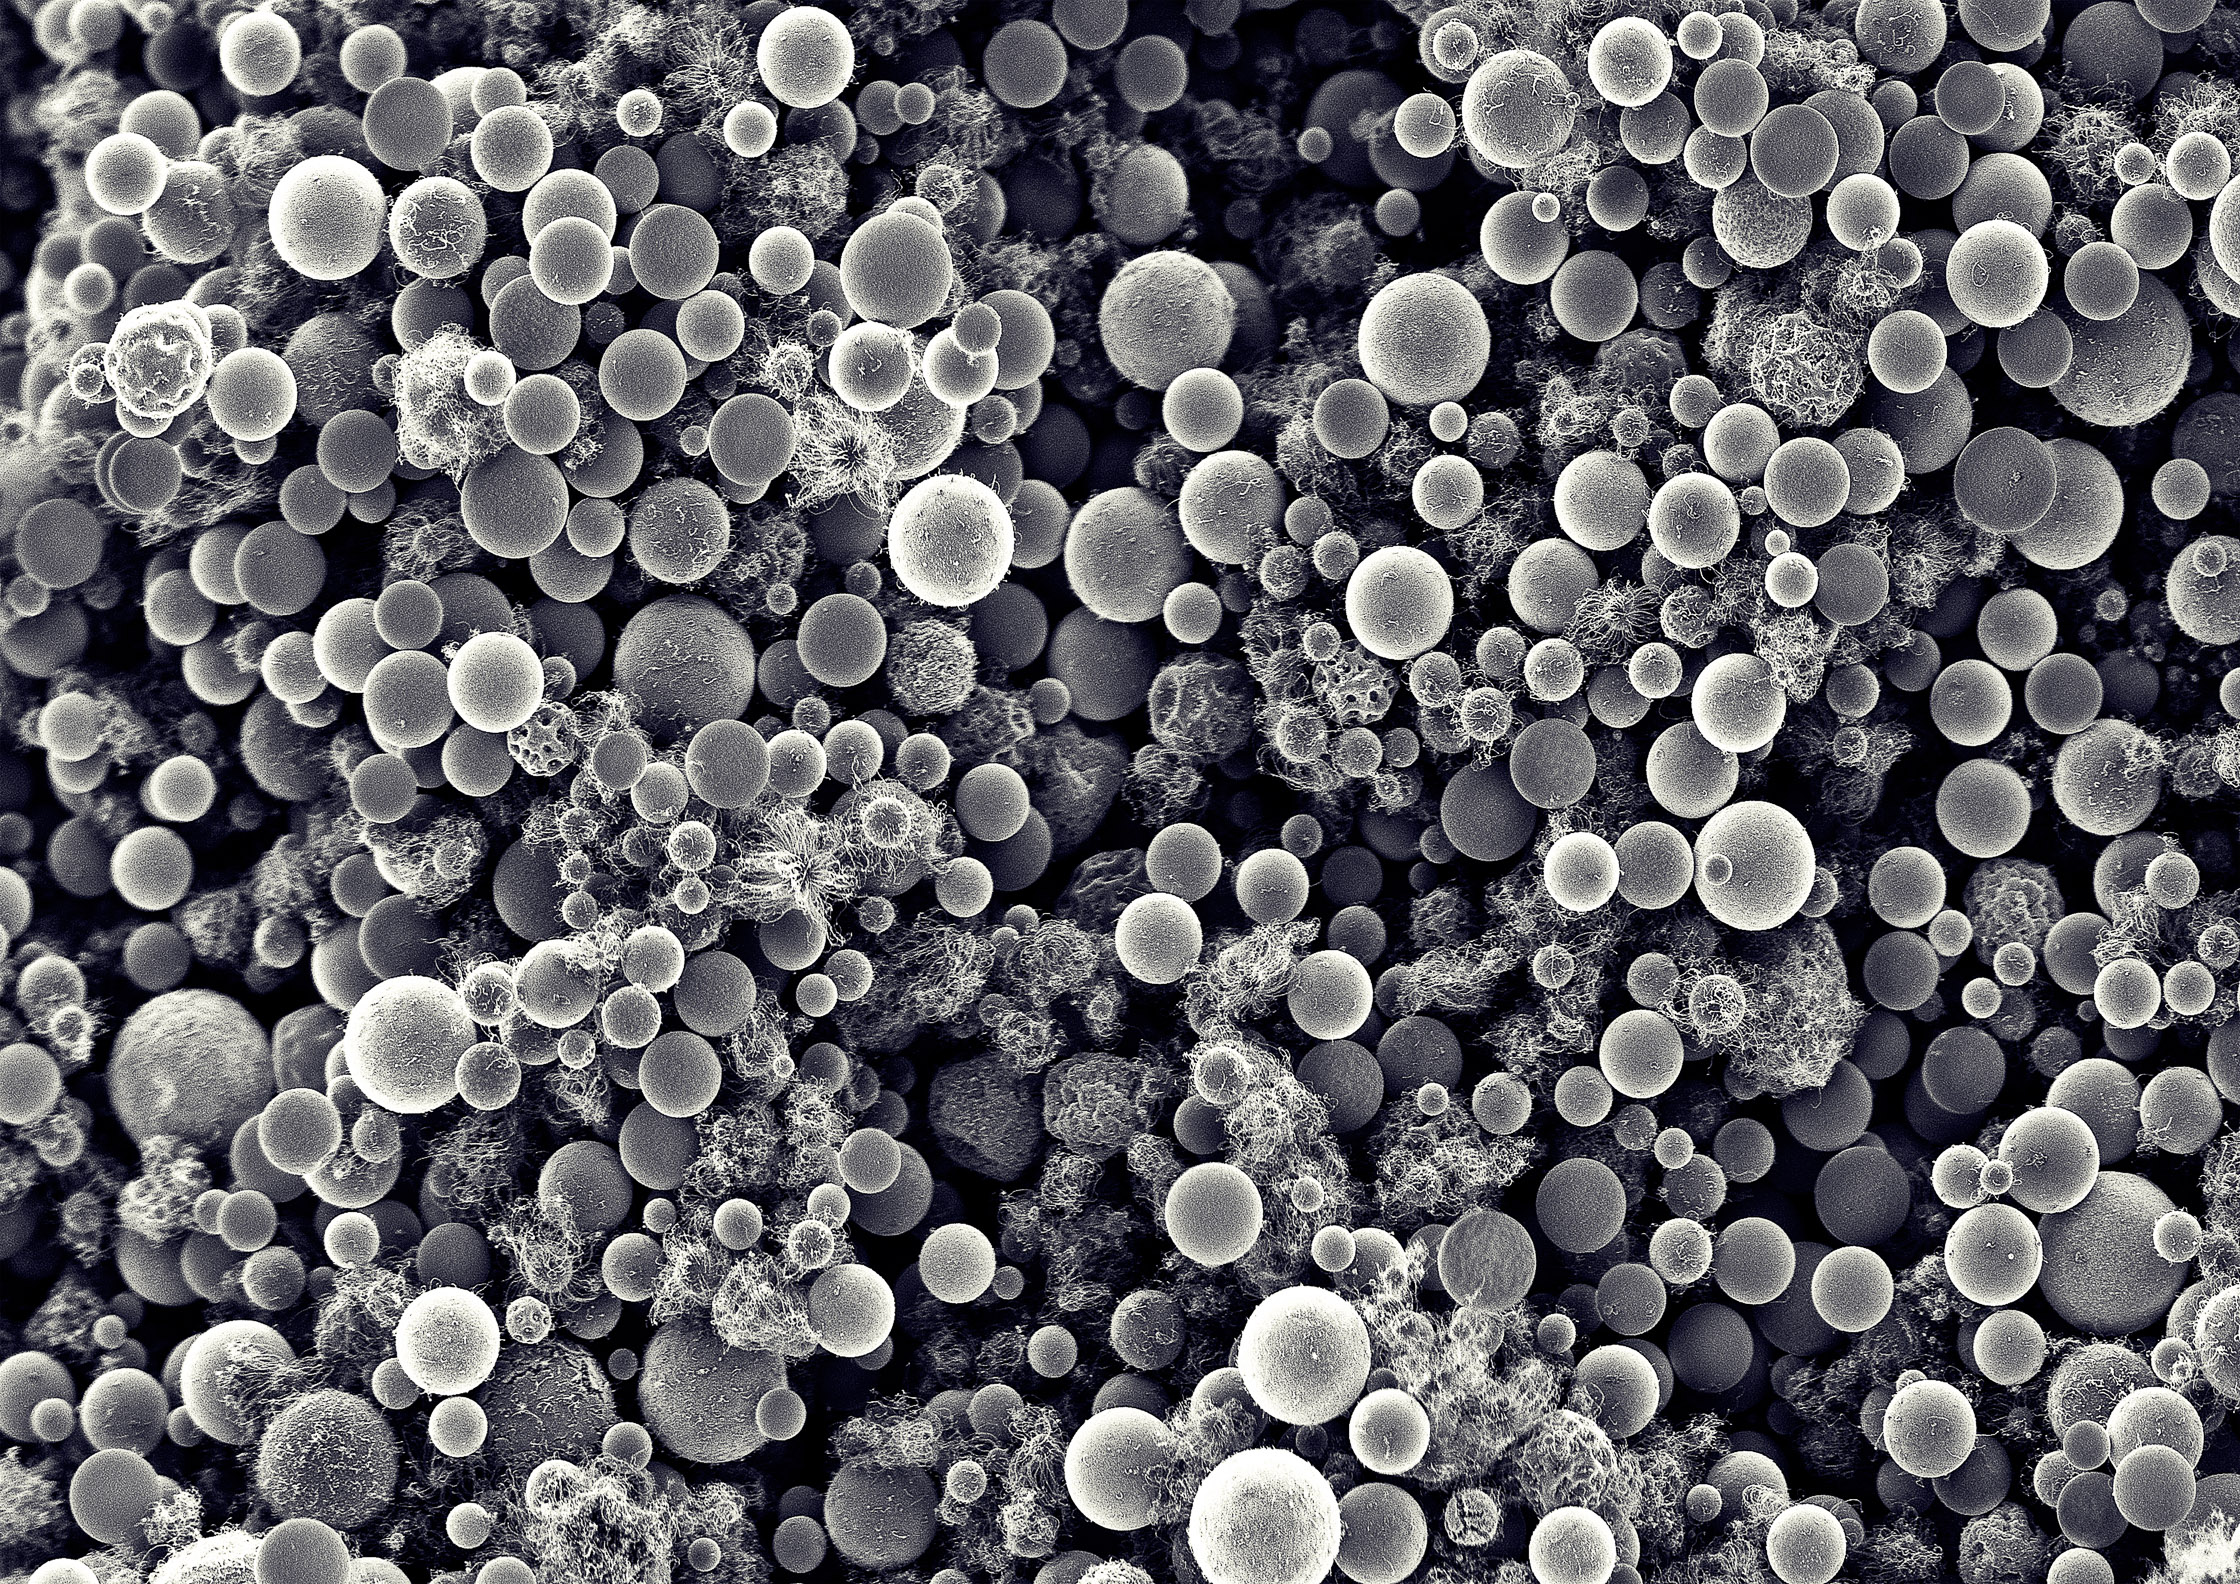
Christian Hoecker and Jean de la Verpilliere
Department of Engineering, University of Cambridge
Carbon nanotubes are grown from a central nanoparticle, resulting in a structure reminiscent of a sea-urchin. The overall dimension of the sea-urchin is of the order of a few hundreds of nanometers, that is about a thousand times smaller than the diameter of a human hair. This image was produced using a scanning electron microscope, enabling to see nanometer-scale details that optical microscope cannot resolve.
One of the worlds most powerful super computers has calculated and made visible a scene 4.5 billion years past where our solar system is seen to be forming from a distance of 100 billion kilometres. This image presented at over 2.5m in height contrasts with mono-chromatic, textured electron microscopy of the very modern material science of carbon nano-tubes all within a scene less than one thousandth the width of a human hair.
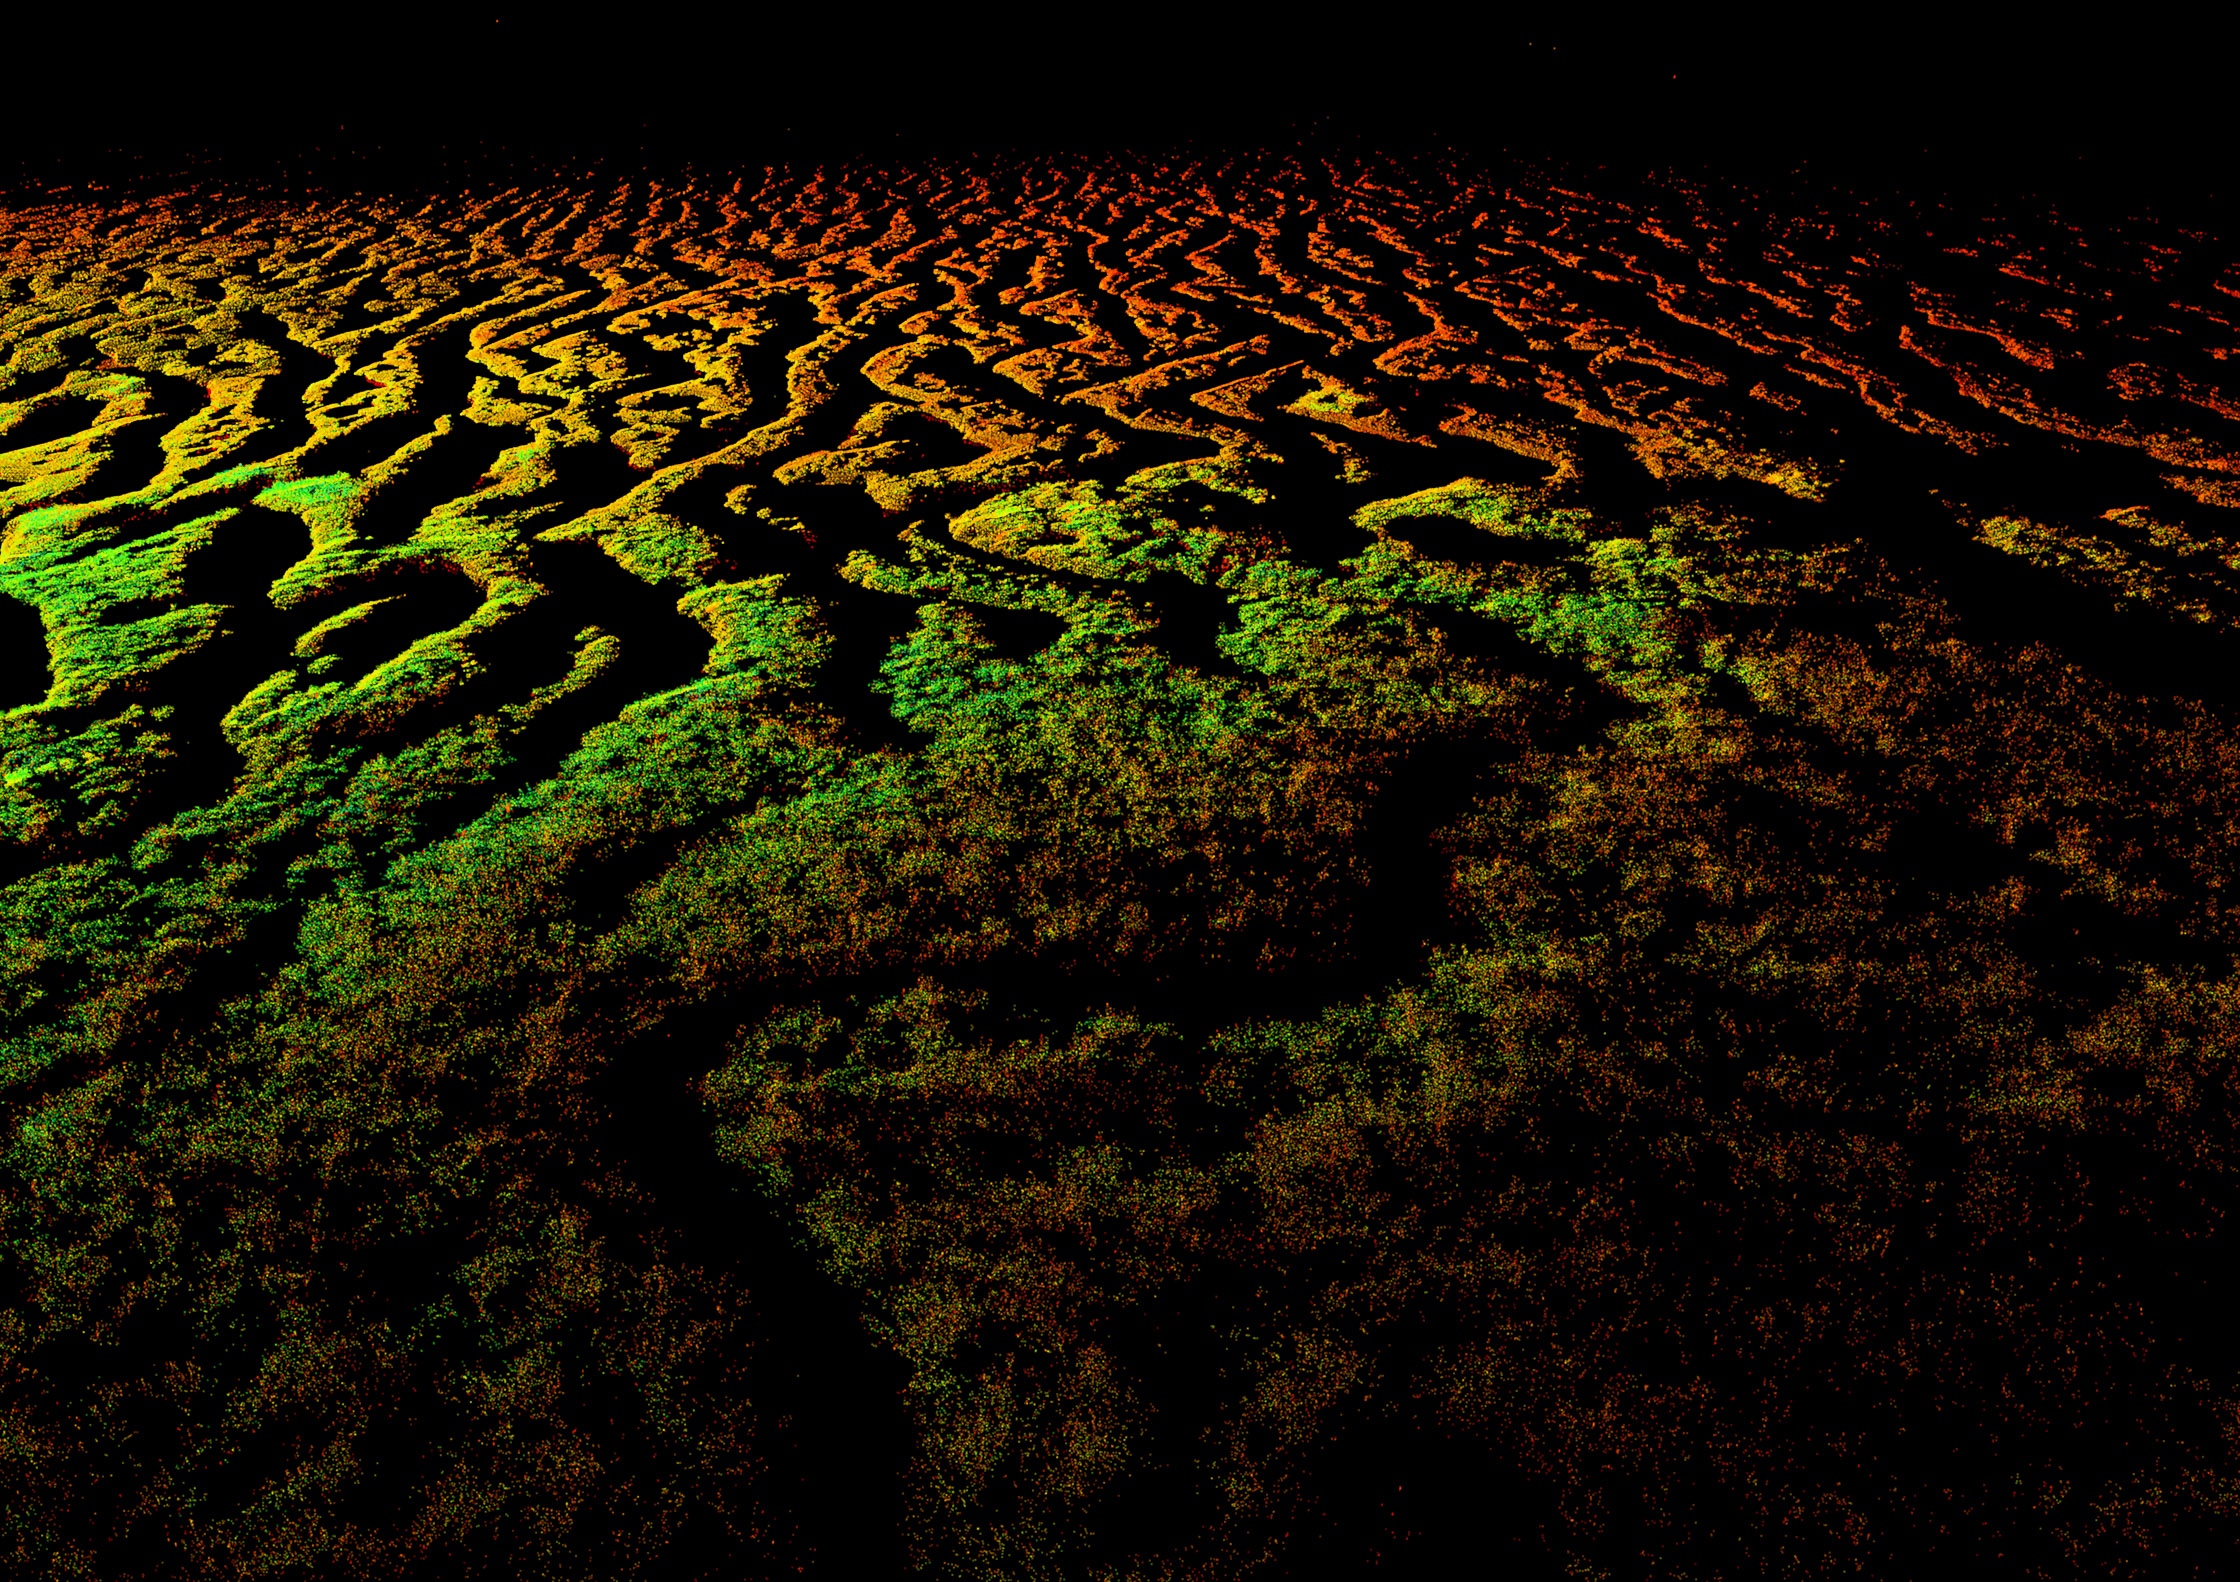
3D laser imaging is enabling scientists to see beyond our visible spectrum and delve into familiar landscapes through the new prism of big data and point clouds. These 4D topographies are rich in hidden meaning; tank positions of WW2 are revealed beneath dense tree cover, forest canopies demonstrate their carbon values and the delicate contours of powder snow are made solid for advanced study.
-
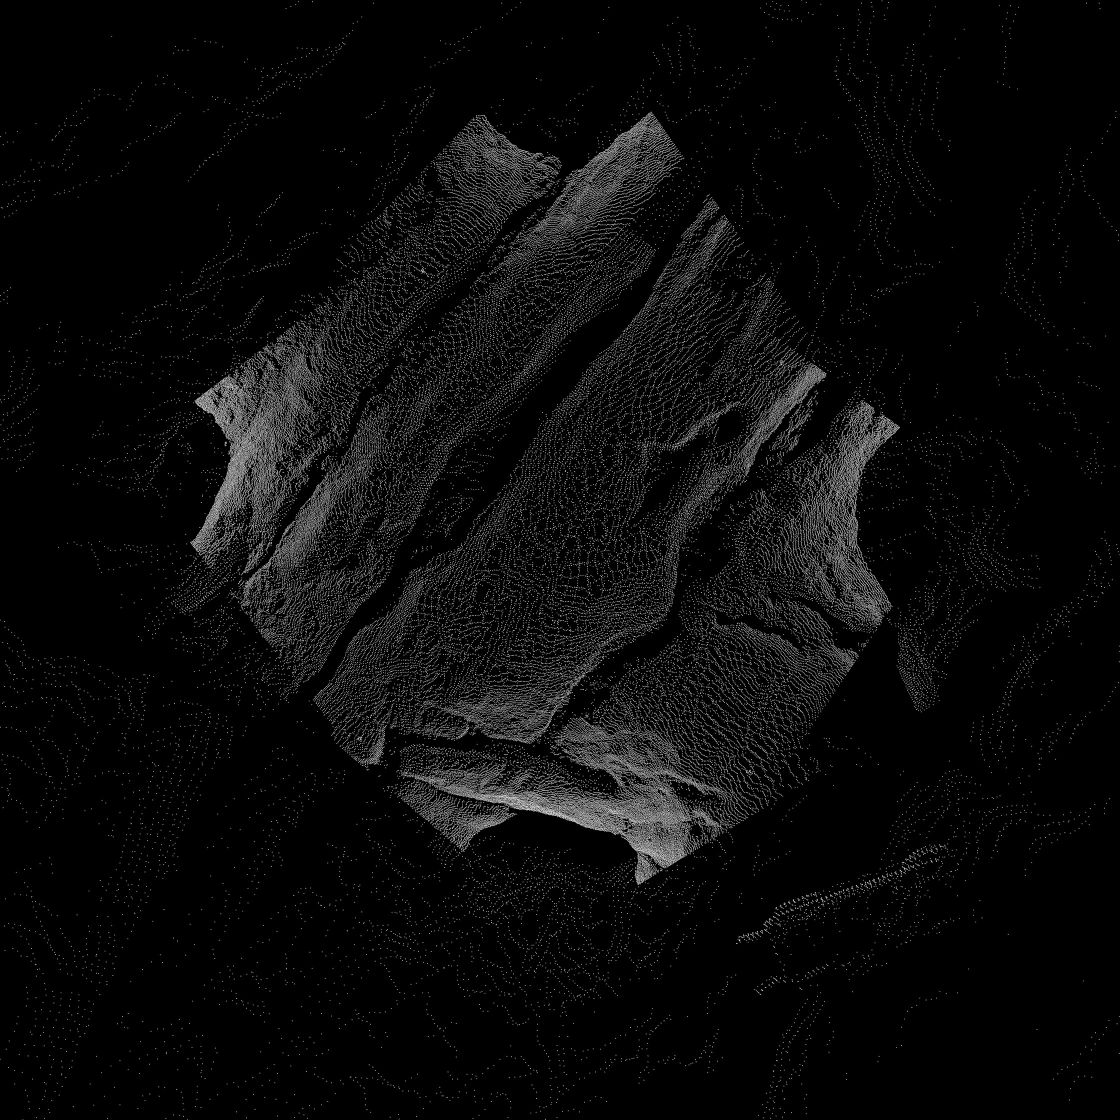
Gareth Rees, Ian Willis and Neil Arnold from the Scott Polar Research Institute (SPRI) use a Terrestrial Laser Scanner to collect very detailed information about the shape of a solid surface. By scanning pulses of laser radiation across it and measuring the time for the echoes of the pulses to return. The three-dimensional array of locations where the pulses bounced off the surface is called a point cloud. In summer 2008 a team from the Scott Polar Research Institute, SPRI, was deployed to Iceland to study the Langjökull ice cap, and a TLS was used to map a small part of its surface in very great detail. This image, which represents an area approximately 20 metres square, is the projection of the point cloud onto a horizontal plane. It consists of 123849 dots, whose positions in the image are controlled by both the scanning pattern of the TLS and the ridged topography of the icy surface. The TLS also viewed the truck – visible at the bottom right of the image - that was used to transport equipment and scientists onto the ice cap.
-

David Coomes created a canopy Height Model extracted from LIDAR data acquired over the Sepilok Forest Reserve with overlays of the individual tree crowns automatically delineated with an in-house developed software. In this image it is possible to see how the carbon content of oil palm plantations is much lower than the one of the natural forest. The rainforest carbon totals, left of frame, dwarf the amounts stored in the commercial oil palm plantation, shaded orange/cream, to the right of frame.
-
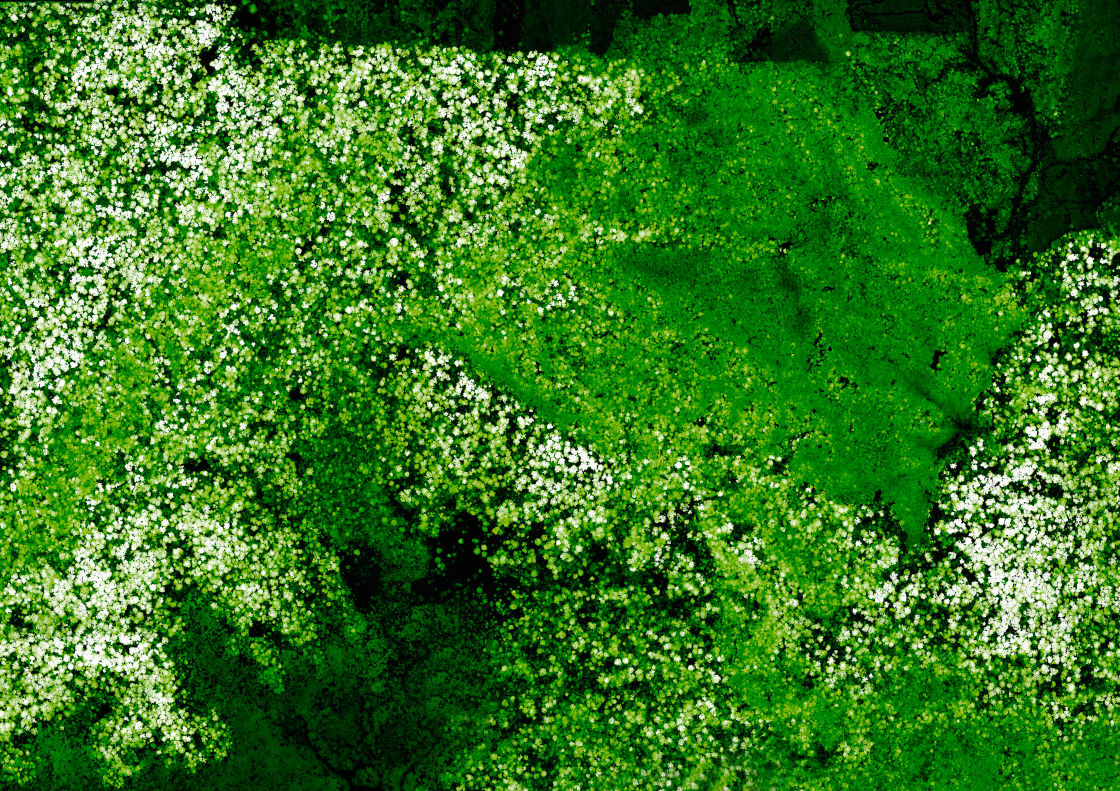
Shown is Sepilok reserve in Malaysia is illustrated by a false coloured elevation map created from an airborne laser scan of a dense rainforest. Sepilok Reserve is one of the few untouched forests left in the lowlands of Sabah, surrounded by vast oil palm plantations. A myriad of tiny streams are etched into gentle hills, draining down into a mangrove swamp in the bottom left corner of the image.
-
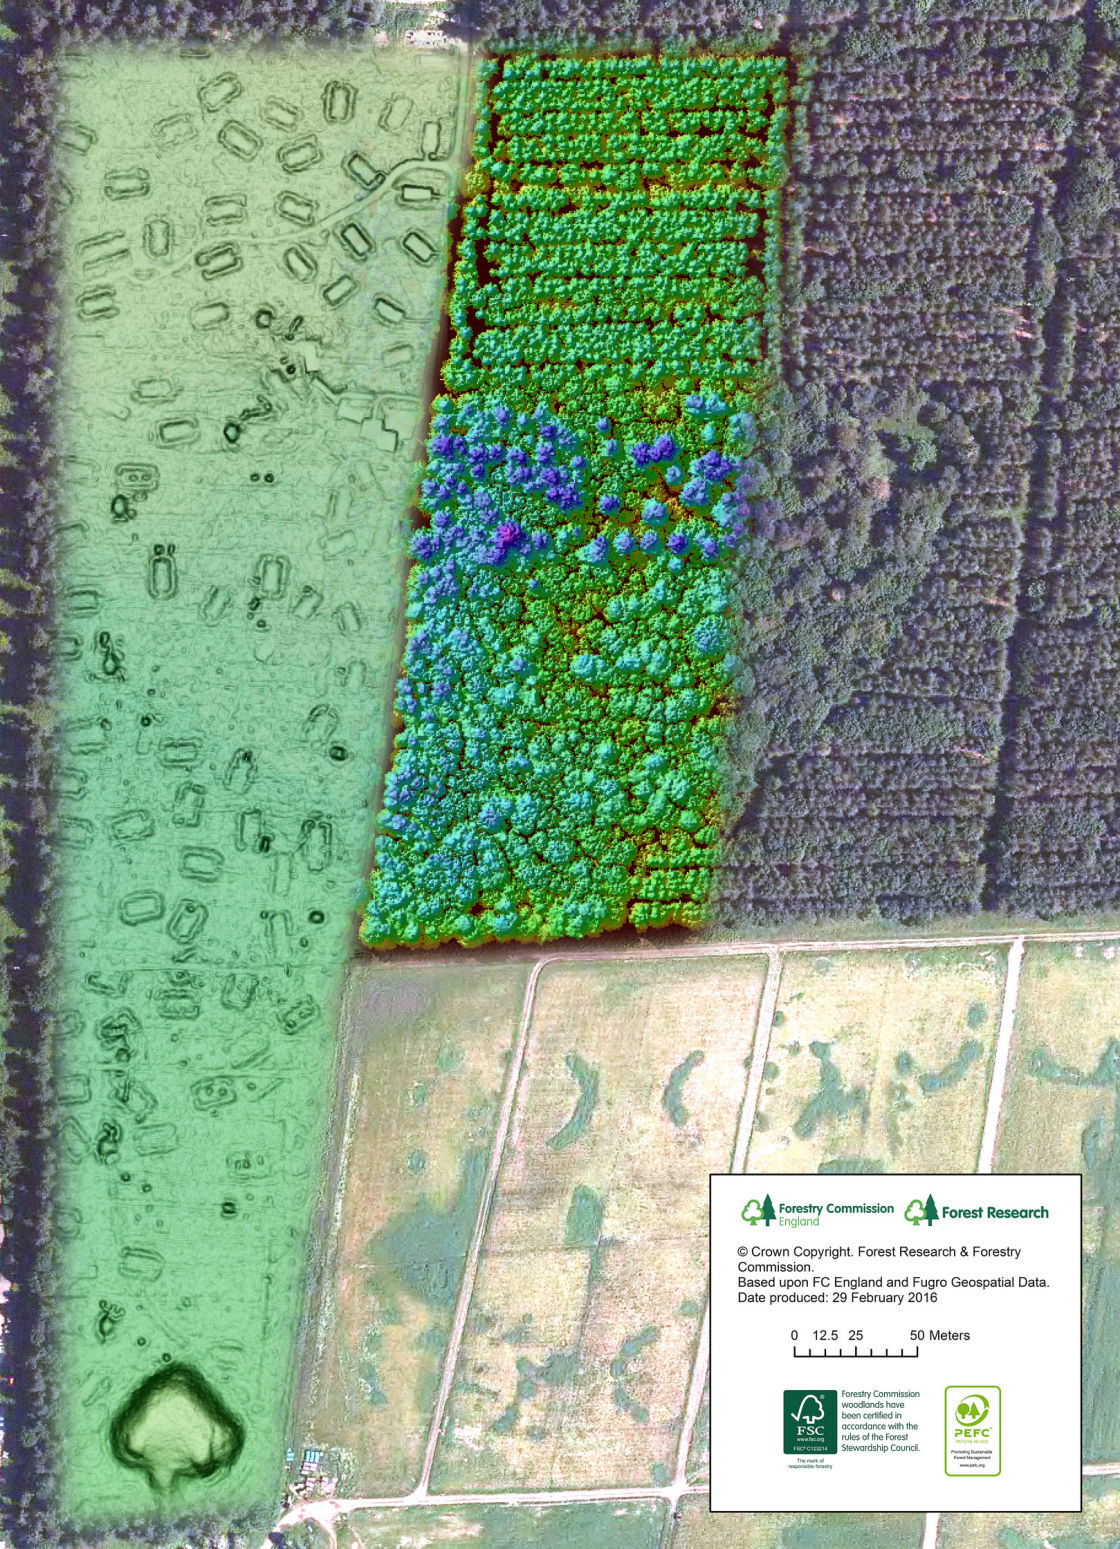
Eleanor Tew presents an image that shows how light detection and radar technology, LiDAR, can be used to reveal different features in a landscape. Here we have a continuous section of Thetford Forest in Norfolk represented by an aerial photo, a LiDAR image of the tree canopy cover (the top middle section), and a LiDAR image of the ground layer (the left section). The LiDAR survey at Thetford Forest was instigated by the Forestry Commission and partners to explore the underlying archaeology of the forest – stripping away the tree cover here reveals the impressions of a WW2 Desert Rats camp. It is impossible to detect this from aerial photos alone, and extremely difficult to find these impressions by walking through the forest.
Alison Harvey
University of Cambridge Conservation Research Institute
For biodiversity conservation to be effective, we need to understand how to protect and manage the landscapes and species we are saving; we need to learn about the functions of the ecosystems we hope to sustain and crucially we need to comprehend how all of these interact with people. Such a vast array of knowledge can only be gained through multiple disciplines, as wide-ranging as chemistry to social anthropology.
We established the University of Cambridge Conservation Research Institute (UCCRI) to promote this interdisciplinary approach to conservation and as a result our exhibition ‘Beyond Images’, curated by UCCRI’s artist in residence, Toby Smith, has drawn images from research within the social and natural sciences and brought them together through their diverse imaging processes. We hope that as you enjoy the visual aesthetic of this collection you will be encouraged to take a closer look and discover some powerful datasets generated by conservation researchers from across the University.
James Tempest
Cambridge Coastal Research Unit, Department of Geography, University of Cambridge
Tidal mudflats from the perspective of a laser scanner, taken near Tillingham in Essex, during June, 2015. This image was produced by a terrestrial laser scanner, an instrument that fires millions of laser beams every second at its target landscape. Some of the laser beams are reflected off the mudflat itself, plants and even algae can detected by the scanner, alongside the exact position where the reflection occurs. The data allows a 3D image to be generated with the colours indicating the distance and strength of the reflection. The colours provide us with additional information such as the type of material the laser beam has been reflected from. This data has been used in my PhD where I’m investigating new techniques that can quickly measure plant properties (plant height, biomass etc.) and salt-marsh topography over large areas. This is important for determining the effect of plants and topography in reducing tidal flow and wave energy, and may one day be used to provide better predictions of flood risk in coastal areas.
-
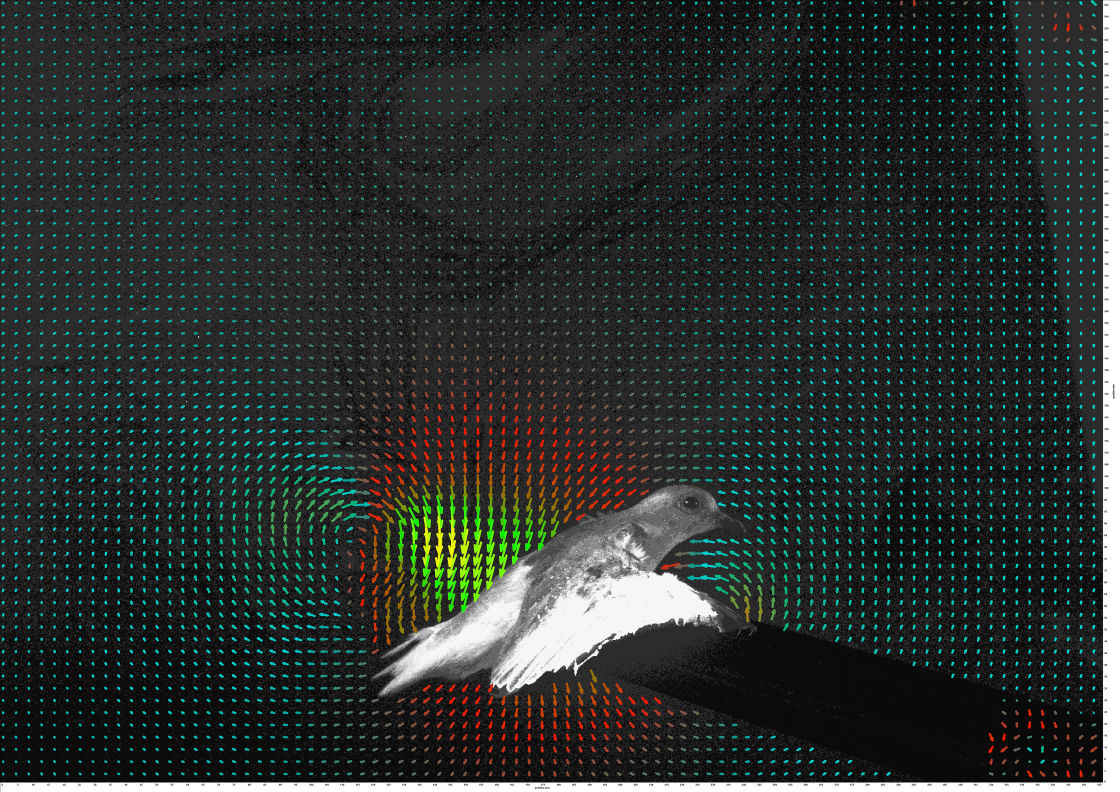
Kristen Candell studies air velocities (coloured arrows) in the wake of flying birds. This image was created with a technique called Particle Image Velocimetry (PIV). The air is filled with aerosolized olive oil particles (which are neutrally buoyant), and a laser is used to illuminate a sheet of particles. A camera takes two successive images in quick succession, whilst a computer tracks motion of individual particles between images, resulting in velocity vectors (coloured arrows).
-
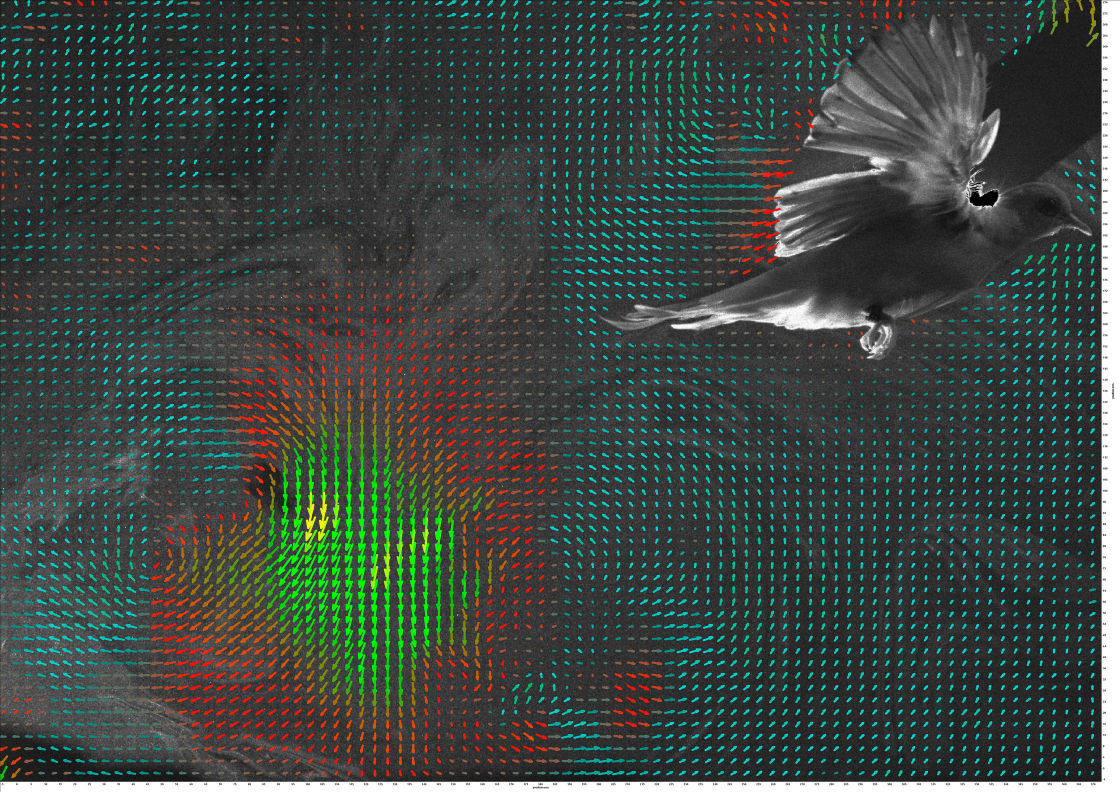
Animals are much smaller subjects than that commonly understood by the aeronautic industry and the air surrounding them is effectively more viscous. My research helps us understand how small changes in wing shape can have large changes in airflow, and thus, force production. This contributes to our understanding of animal flight, alongside helping us build more efficient wing designs and small aerial robots.
Neil Arnold – Scott Polar Research Institute (SPRI)
You are seeing the sun illuminate a glacier in Svalbard over the course of an entire summer, projecting shadows onto the surface. It looks ‘real’ , if panchromatic, , but the surface elevation data is based on height measurements by an airborne laser scanner. The ‘colouring’ is based on the reflectance of the surface to the laser, not a photograph. The shadows by the surrounding mountains are projected onto the surface using similar mathematical techniques utilised in video games to make computer generated landscapes look realistic. However, they are being used here to enable accurate calculation of the receipt of solar energy on the glacier surface and therefore allow surface melt to be calculated accurately over the whole glacier surface for an entire summer. If you watch for the video carefully, you can see that the shadows gradually get longer as the sun gets lower in the sky, and also how the lower part of the glacier becomes darker, as the melt calculations in the model remove the light coloured snow, exposing the darker, debris-containing glacier ice beneath.

Judith Schleicher has processed a satellite image taken from space to show the dramatic impacts of gold mining activities, shown in purple, in the southern Peruvian Amazon. It depicts rivers, a section of the Inter-Oceanic Highway starting in the top right hand corner, and the Andes in the South. The gold mining has significant environmental and social impacts in the region as large extends of tropical forests are converted into mud holes and mercury – used to extract the gold – leaks into the rivers and groundwater.
-
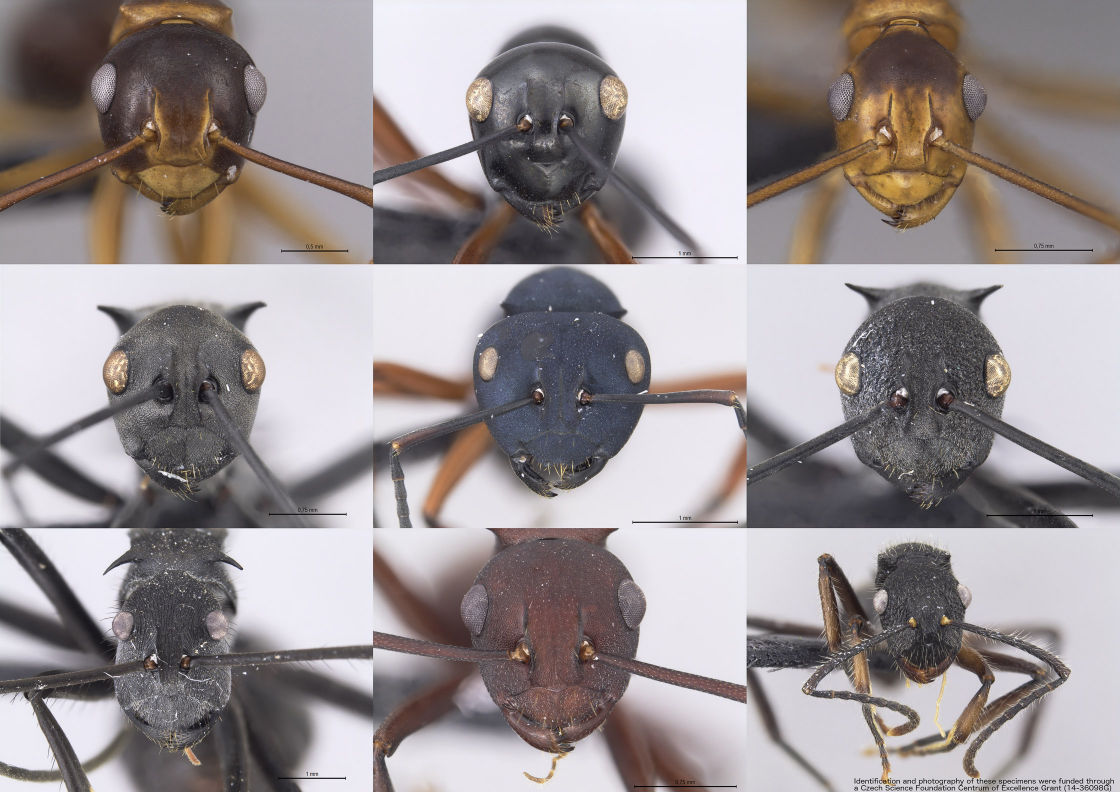
Amelia Hood created an image that shows the faces of nine species in the diverse ant genus Polyrhachis. Each image was made up from multiple photos, each with a different point of focus, taken under a light microscope. These photos were knitted together using the software Leica Application Suite. They were taken as part of a research project, led by Dr Tom Fayle of the Biology Centre of the Czech Academy of Sciences, investigating the structure of arboreal ant mosaics in Bornean rainforest. Little is known about the mechanisms that underpin these complex assemblages, despite ants being one of the most influential groups of organisms on Earth.
-

These are microscopic analyses on charred residues from pottery recovered from the Late Bronze Age site, c 1000-800 cal BC, of Must Farm, near Peterborough in East Anglia. These images were taken using a scanning electron microscope, SEM, which generates high-magnification images produced by the interaction of a focused beam of electrons with the sample. Some images demonstrated that lenses of organic material were preserved between the vitrified food, which could be identified, enabling a rare reconstruction of an East Anglican Bronze Age meal.
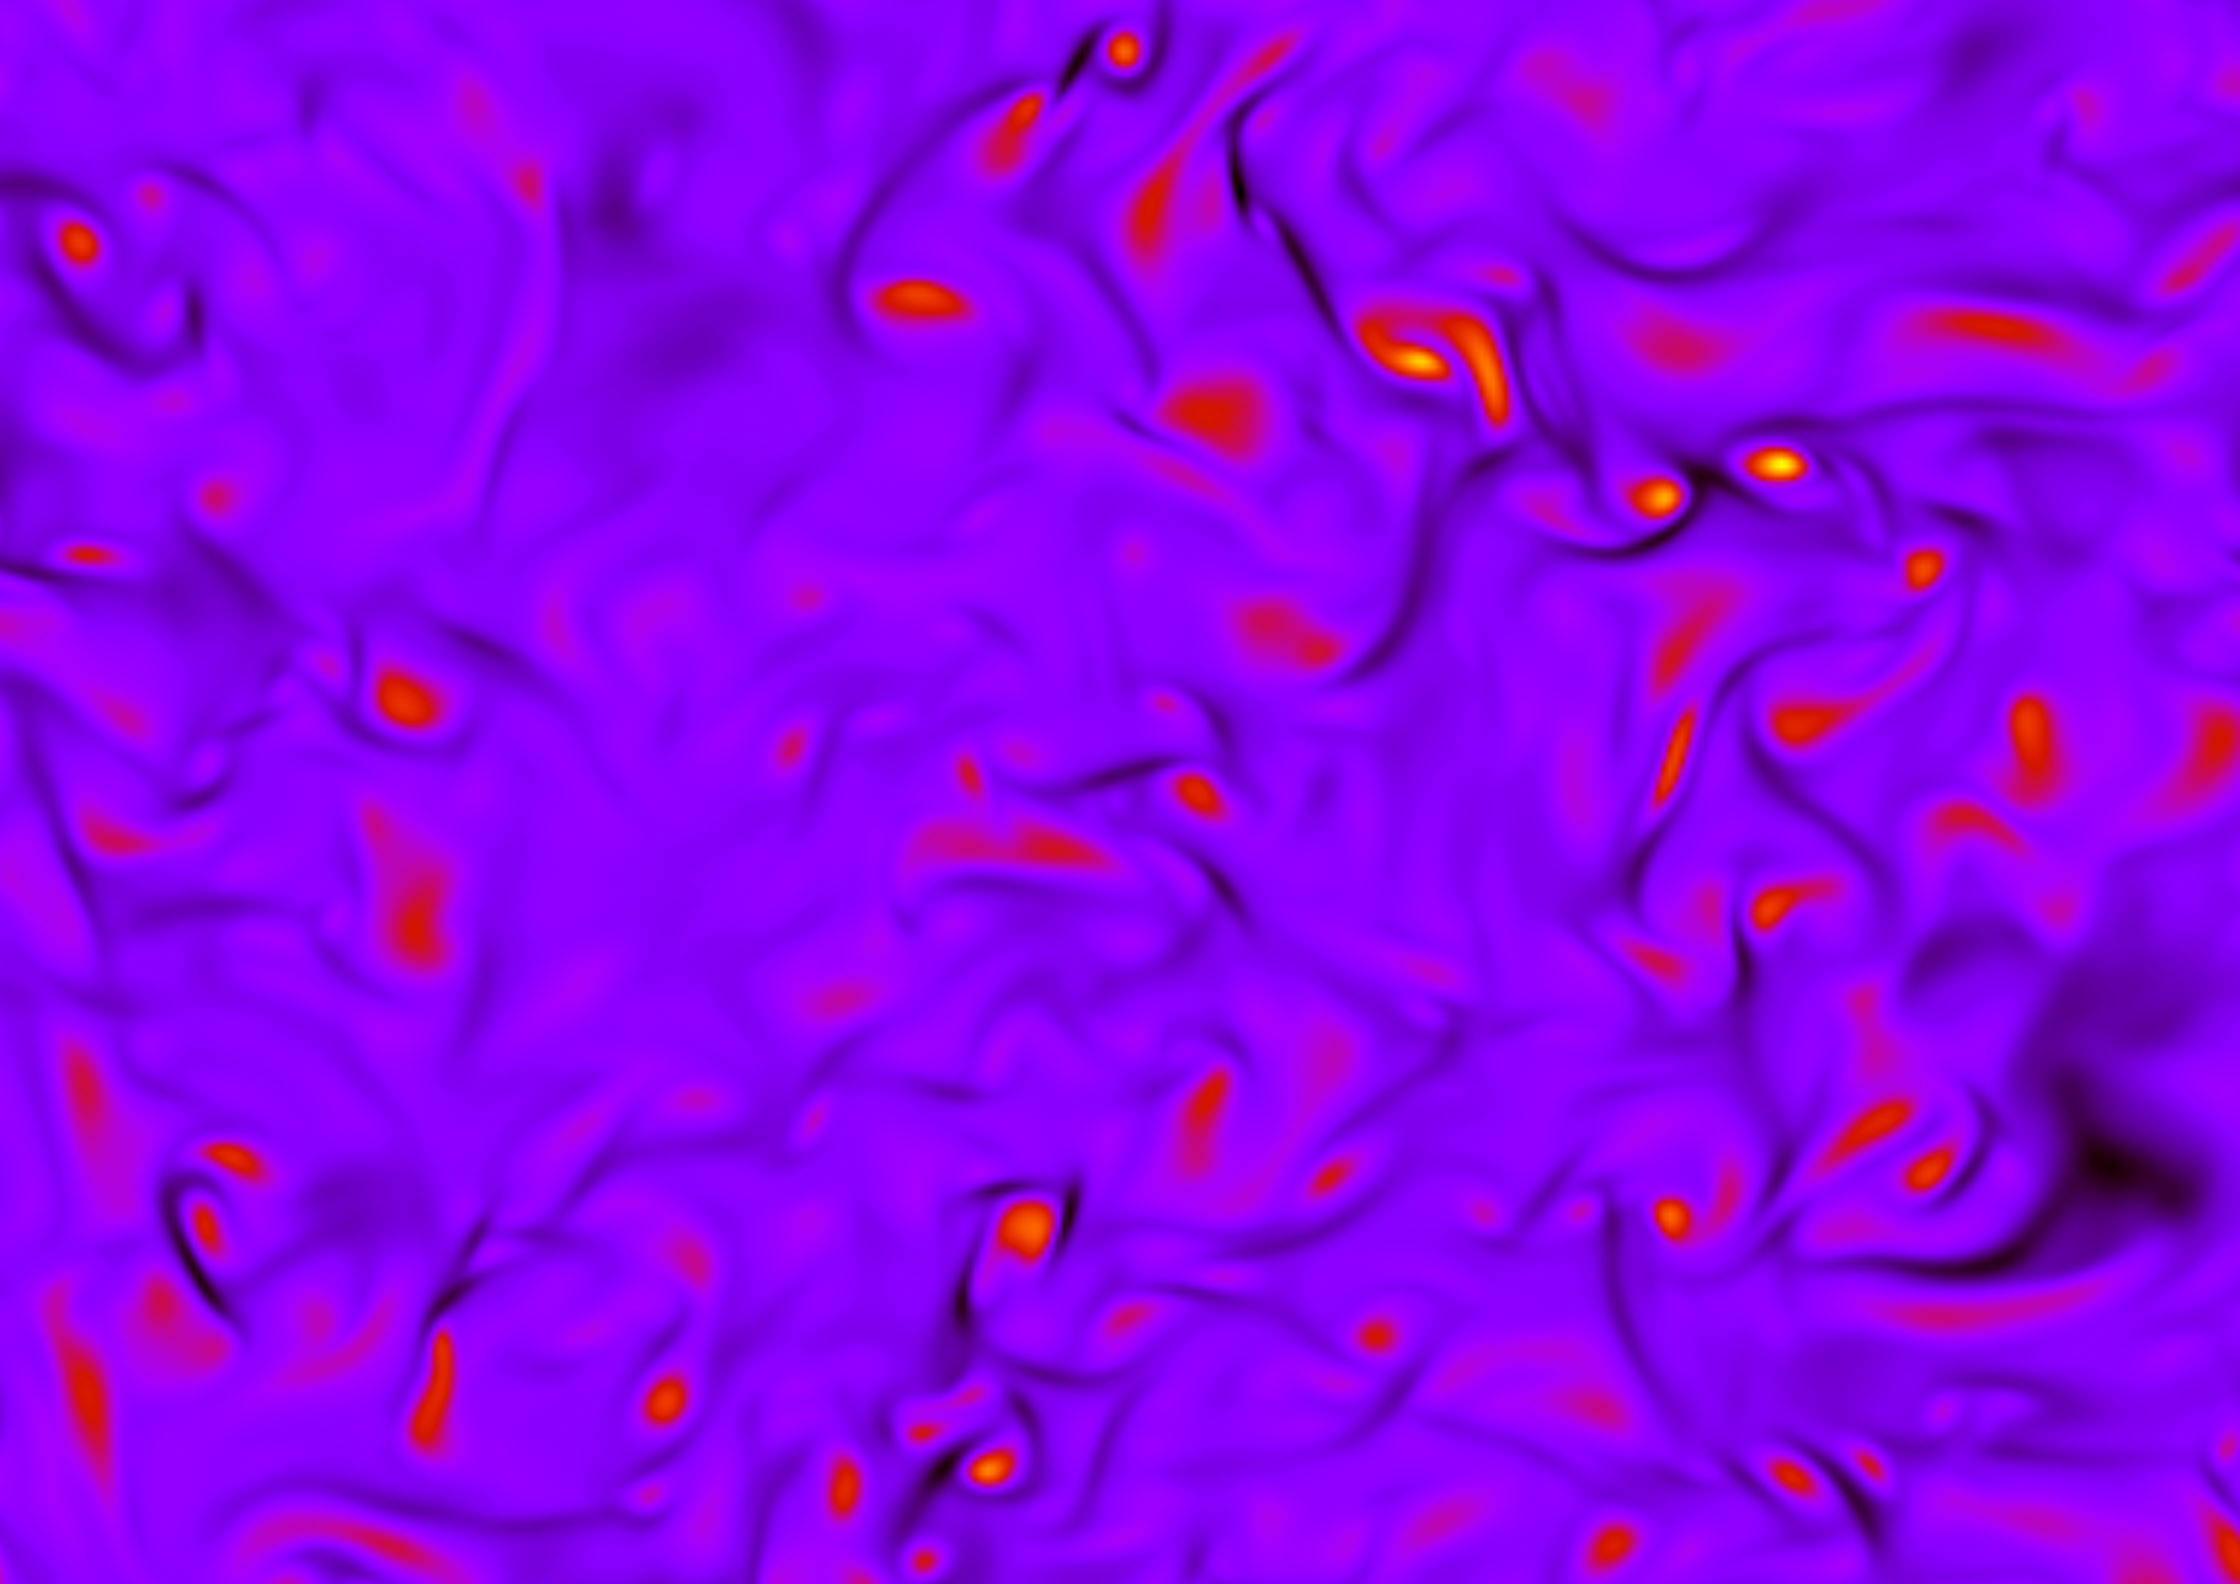
Girish Nivarti
Department of Engineering, University of Cambridge
The image shows fragments of a flame, in orange, being convected by intense turbulence in a small scale simulation of the conditions inside a jet engine. Such results are obtained from solving the governing equations of turbulent flames in parallel on over 96,000 processors at the Archer national supercomputing facility in Edinburgh. The motivation behind generating these data is to understand the effects of turbulence on combustion. Turbulence is known to improve mixing, and thereby improve burning rate and reduce pollutant formation; at the same time, however, turbulence beyond a certain intensity might hamper the burning rate and extinguish the flame inside engines. With a better grasp of the mechanisms involved in turbulence-flame interaction, we can design safer and less-polluting combustion systems.
AIora Zabala, Co-authored with Shaun Larcom and Terry van Gevelt
Some African countries have the fastest rising deforestation rates worldwide and complex governance legacies pose a major challenge for the implementation of policies to address forest loss. You are looking at deforestation rates between 2000 and 2012, corresponding to the area occupied by each institutional entity existing in Africa before the colonisation. The precolonial institutions are categorised in the map by their system to elect chiefs: by inheritance, appointed by a chief at a higher level (from above), by democratic methods, and by social standing. More intense colours correspond to higher rates of deforestation.
Gordon Frazer – The Griffiths Laboratory at the Cambridge institute for Medical Research
This video is captured with a fluorescence spinning disc confocal microscope. Cytotoxic T cells are coloured green and sampling tumour cells white. When a T cell decides to kill its target the centrosome, coloured blue, docks next to the victim allowing targeted release of the contents of cytotoxic granules, red, which force the target cell to commit suicide. These cells are critical in causing autoimmune pathologies and conversely for attacking and controlling tumour and virally infected cells. Such potent and targetable killing has led them to be used as headline grabbing cancer therapies.